📝Python Streamlit 차트 그리기
import streamlit as st
import numpy as np
import pandas as pd
# plotly 라이브러리
import plotly.express as px
# altair 라이브러리
import altair as alt
def main() :
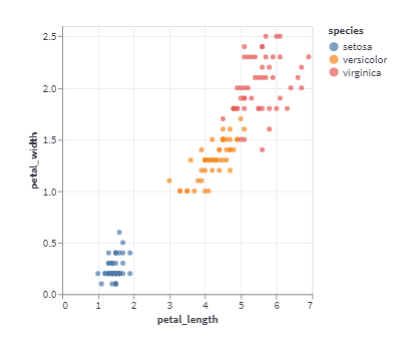
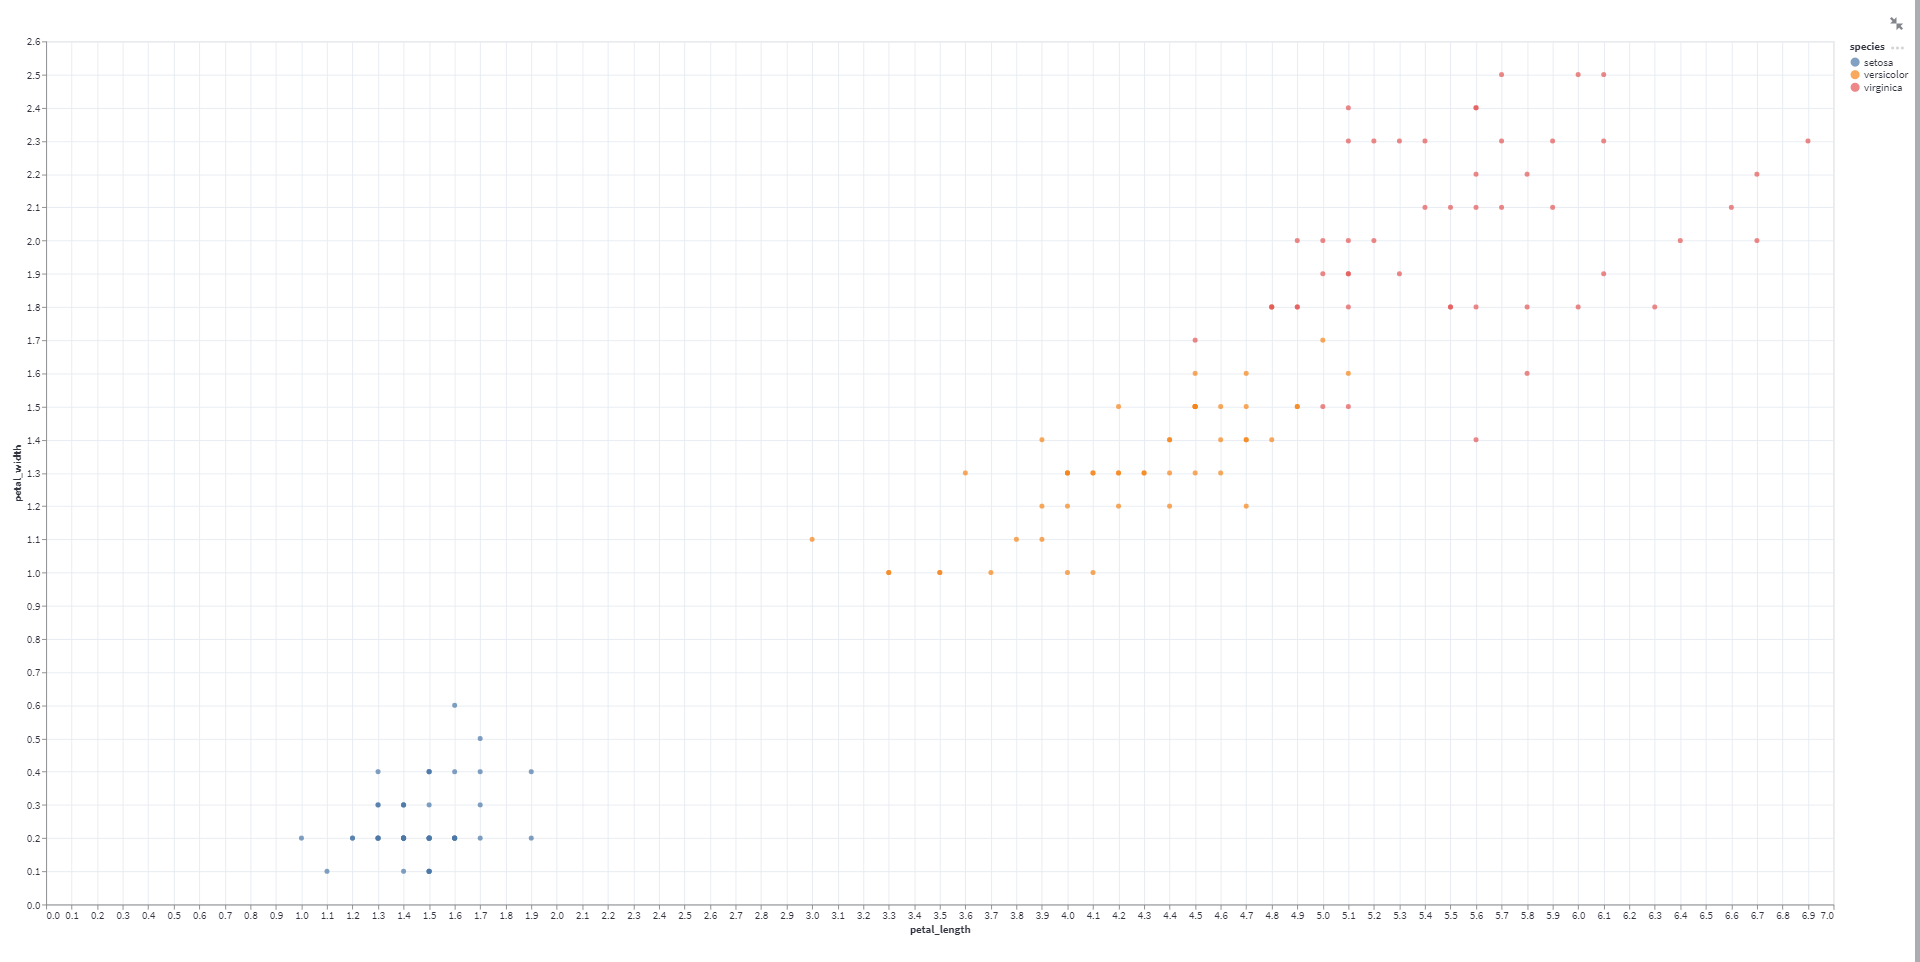
# altair 라이브러리의 mark_cicle 함수 사용법
df2 = pd.read_csv('streamlit_data/iris.csv')
chart = alt.Chart(df2).mark_circle().encode(x= 'petal_length', y= 'petal_width', color ='species')
st.altair_chart(chart)
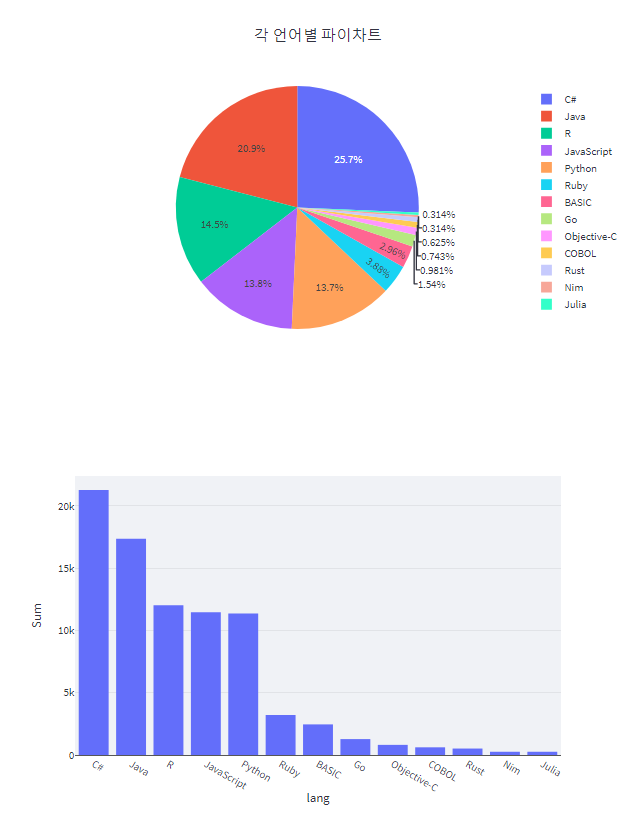
# plotly pie 차트 그리는 방법
df4 = pd.read_csv('streamlit_data/prog_languages_data.csv', index_col=0)
fig6 = px.pie(df4, 'lang', 'Sum', title='각 언어별 파이차트')
st.plotly_chart(fig6)
# plotly bar 차트 그리는 방법
df_sorted= df4.sort_values('Sum', ascending=False)
fig7 = px.bar(df_sorted, x='lang', y='Sum')
st.plotly_chart(fig7)
if __name__ == '__main__' :
main()
실행 결과 ↓
※ 확대 이미지
'Python > Streamlit' 카테고리의 다른 글
| [Python] Streamlit으로 웹 대시보드 만들기 (0) | 2022.12.22 |
|---|---|
| [Python] Streamlit sidebar 만들기 (0) | 2022.12.13 |
| [Python] Streamlit 차트 그리기 line_chart, area_chart, bar_chart, map (0) | 2022.12.13 |
| [Python] Streamlit matplotlib, seaborn 차트 그리기 (0) | 2022.12.13 |
| [Python] Streamlit 파일 분리해서 처리하기 (0) | 2022.12.13 |


댓글